Rubicon Project’s Communications department conducted quarterly Consumer Pulse surveys to aggregate data that would help the company’s buyers and sellers anticipate spending trends in the market. These infographics reflect stories drawn from these data points, and they were used across multiple digital platforms to help support various programs and initiatives at Rubicon Project.
Role: art direction, design, creative strategy
Awards
Graphic Design USA's 2016 Graphic Design Awards
Category: Infographics
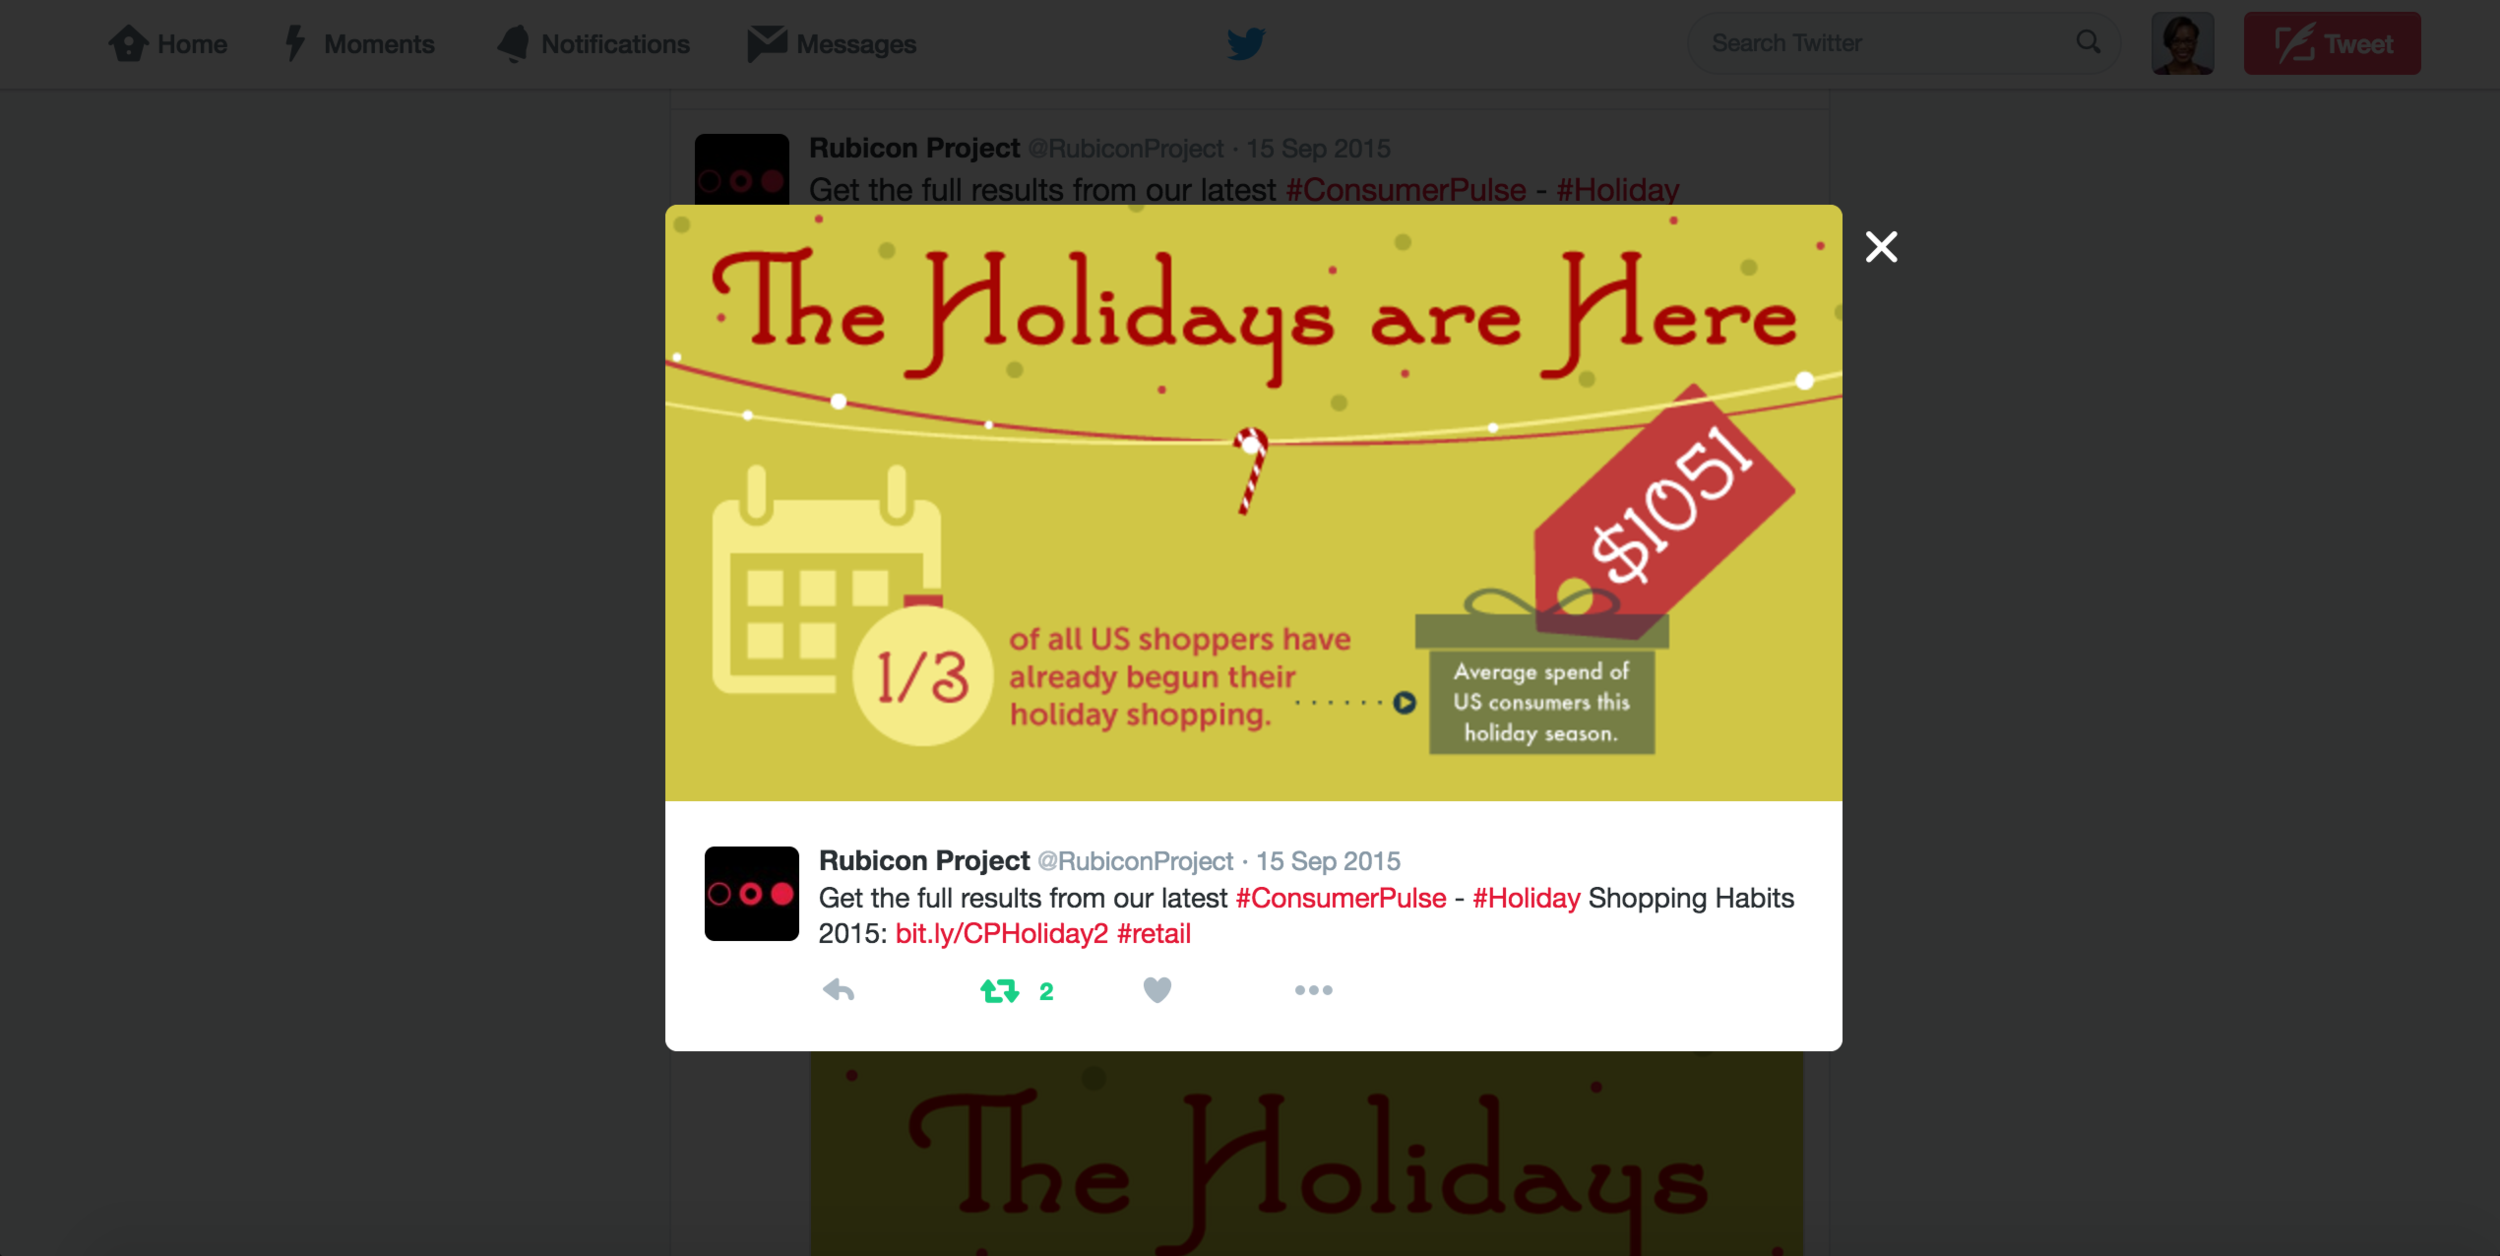
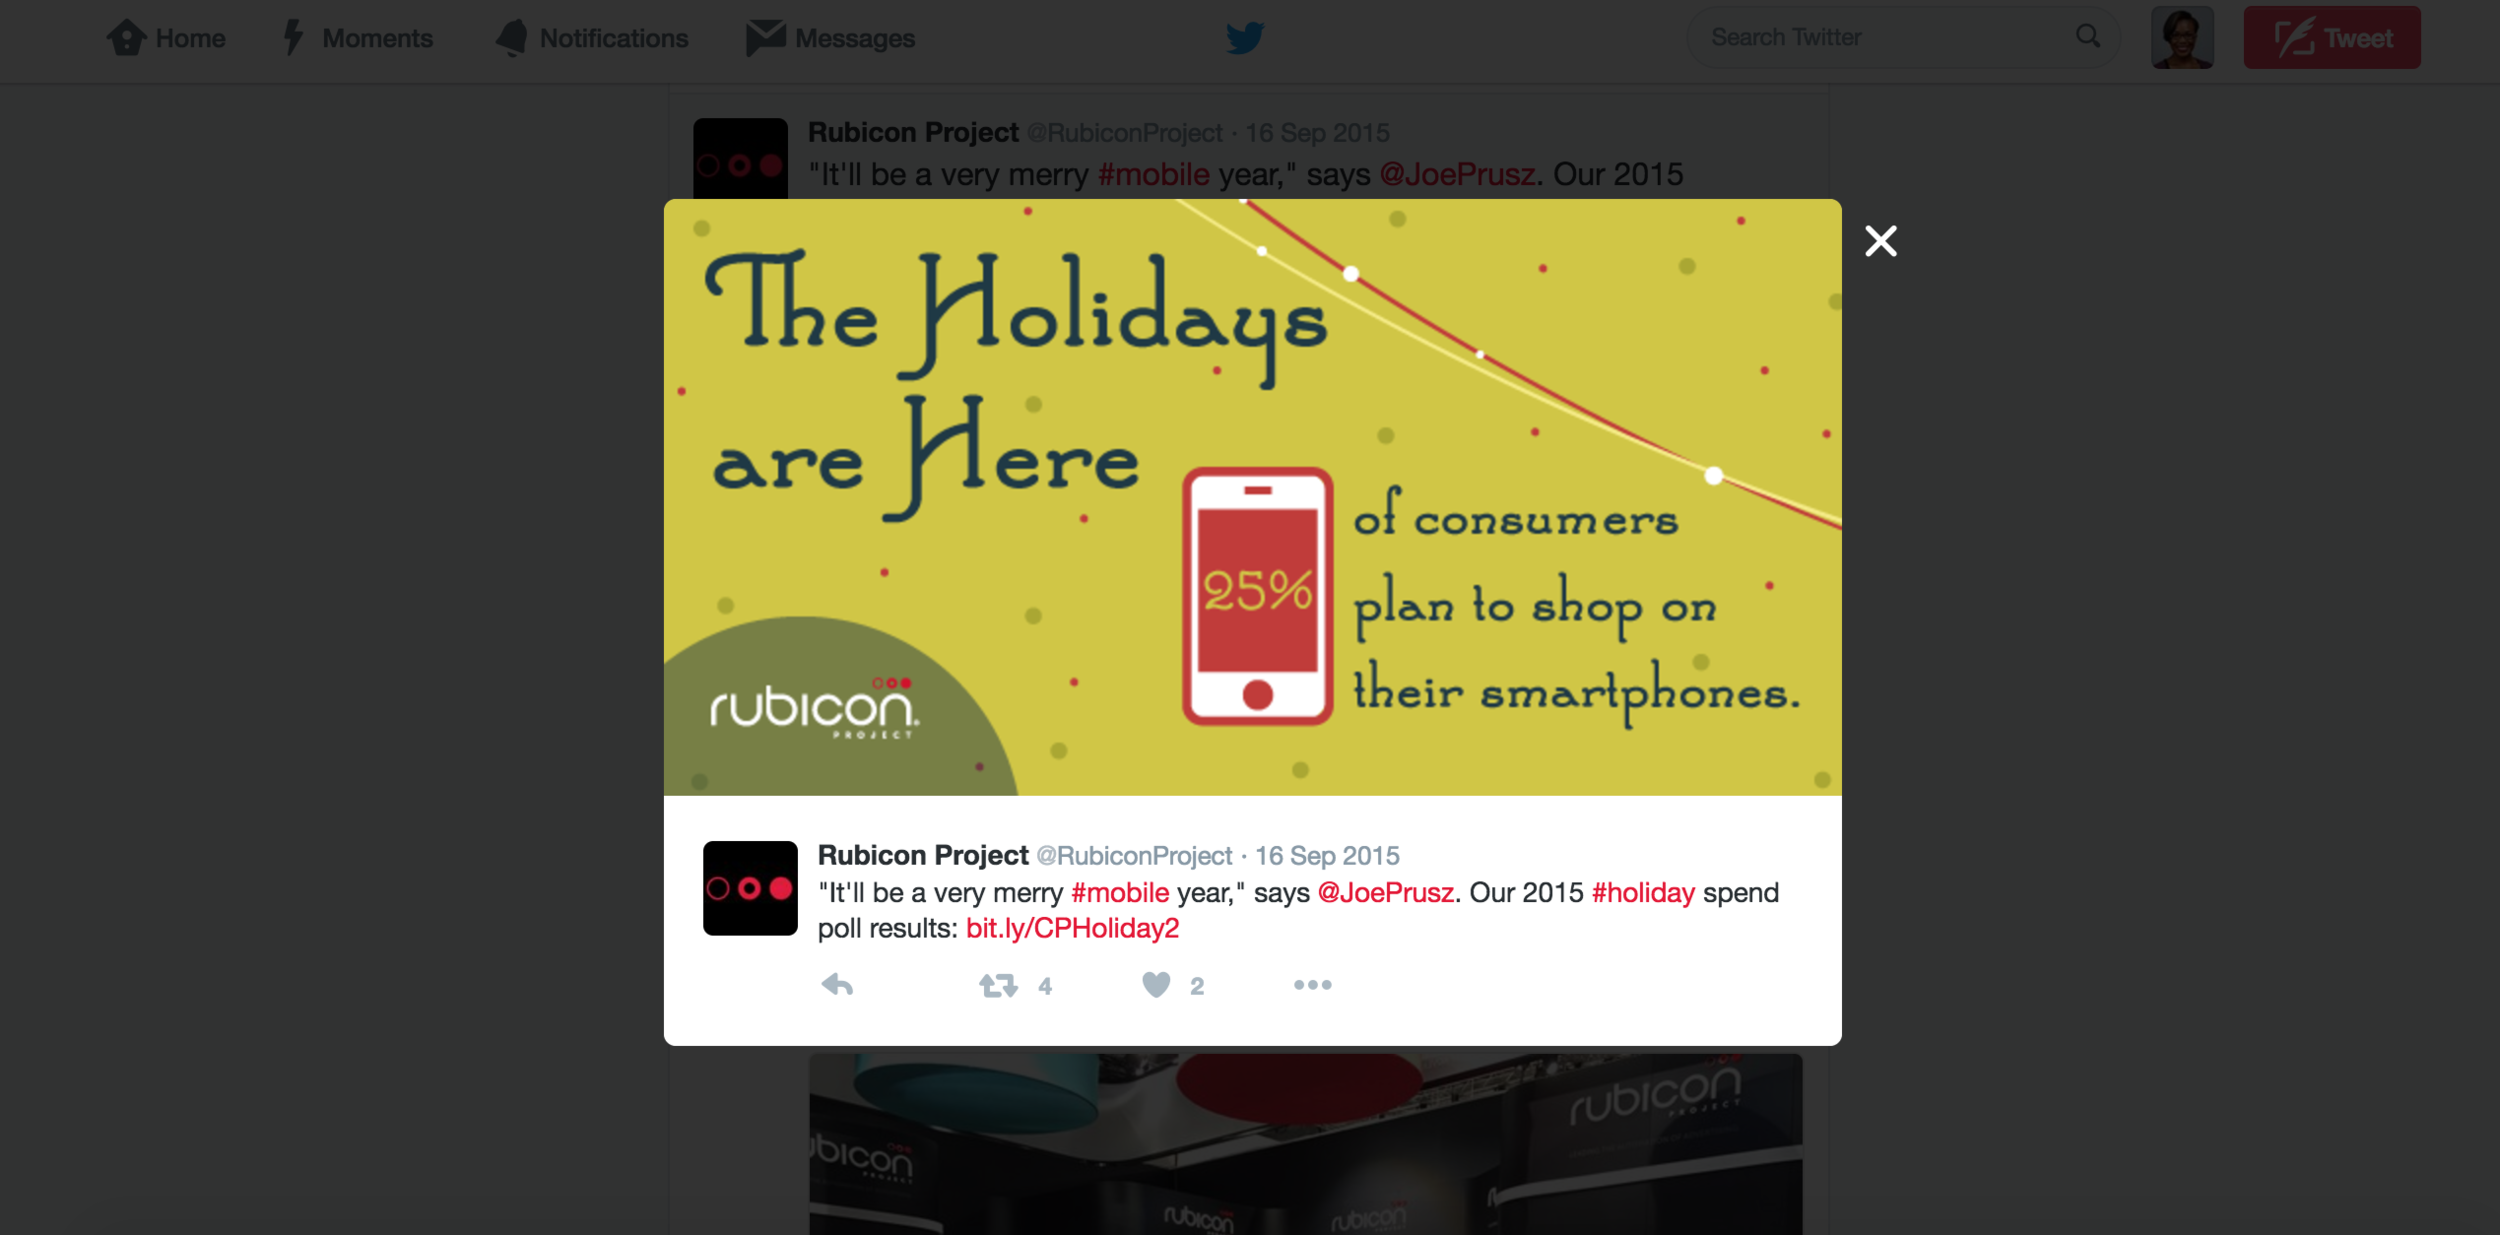
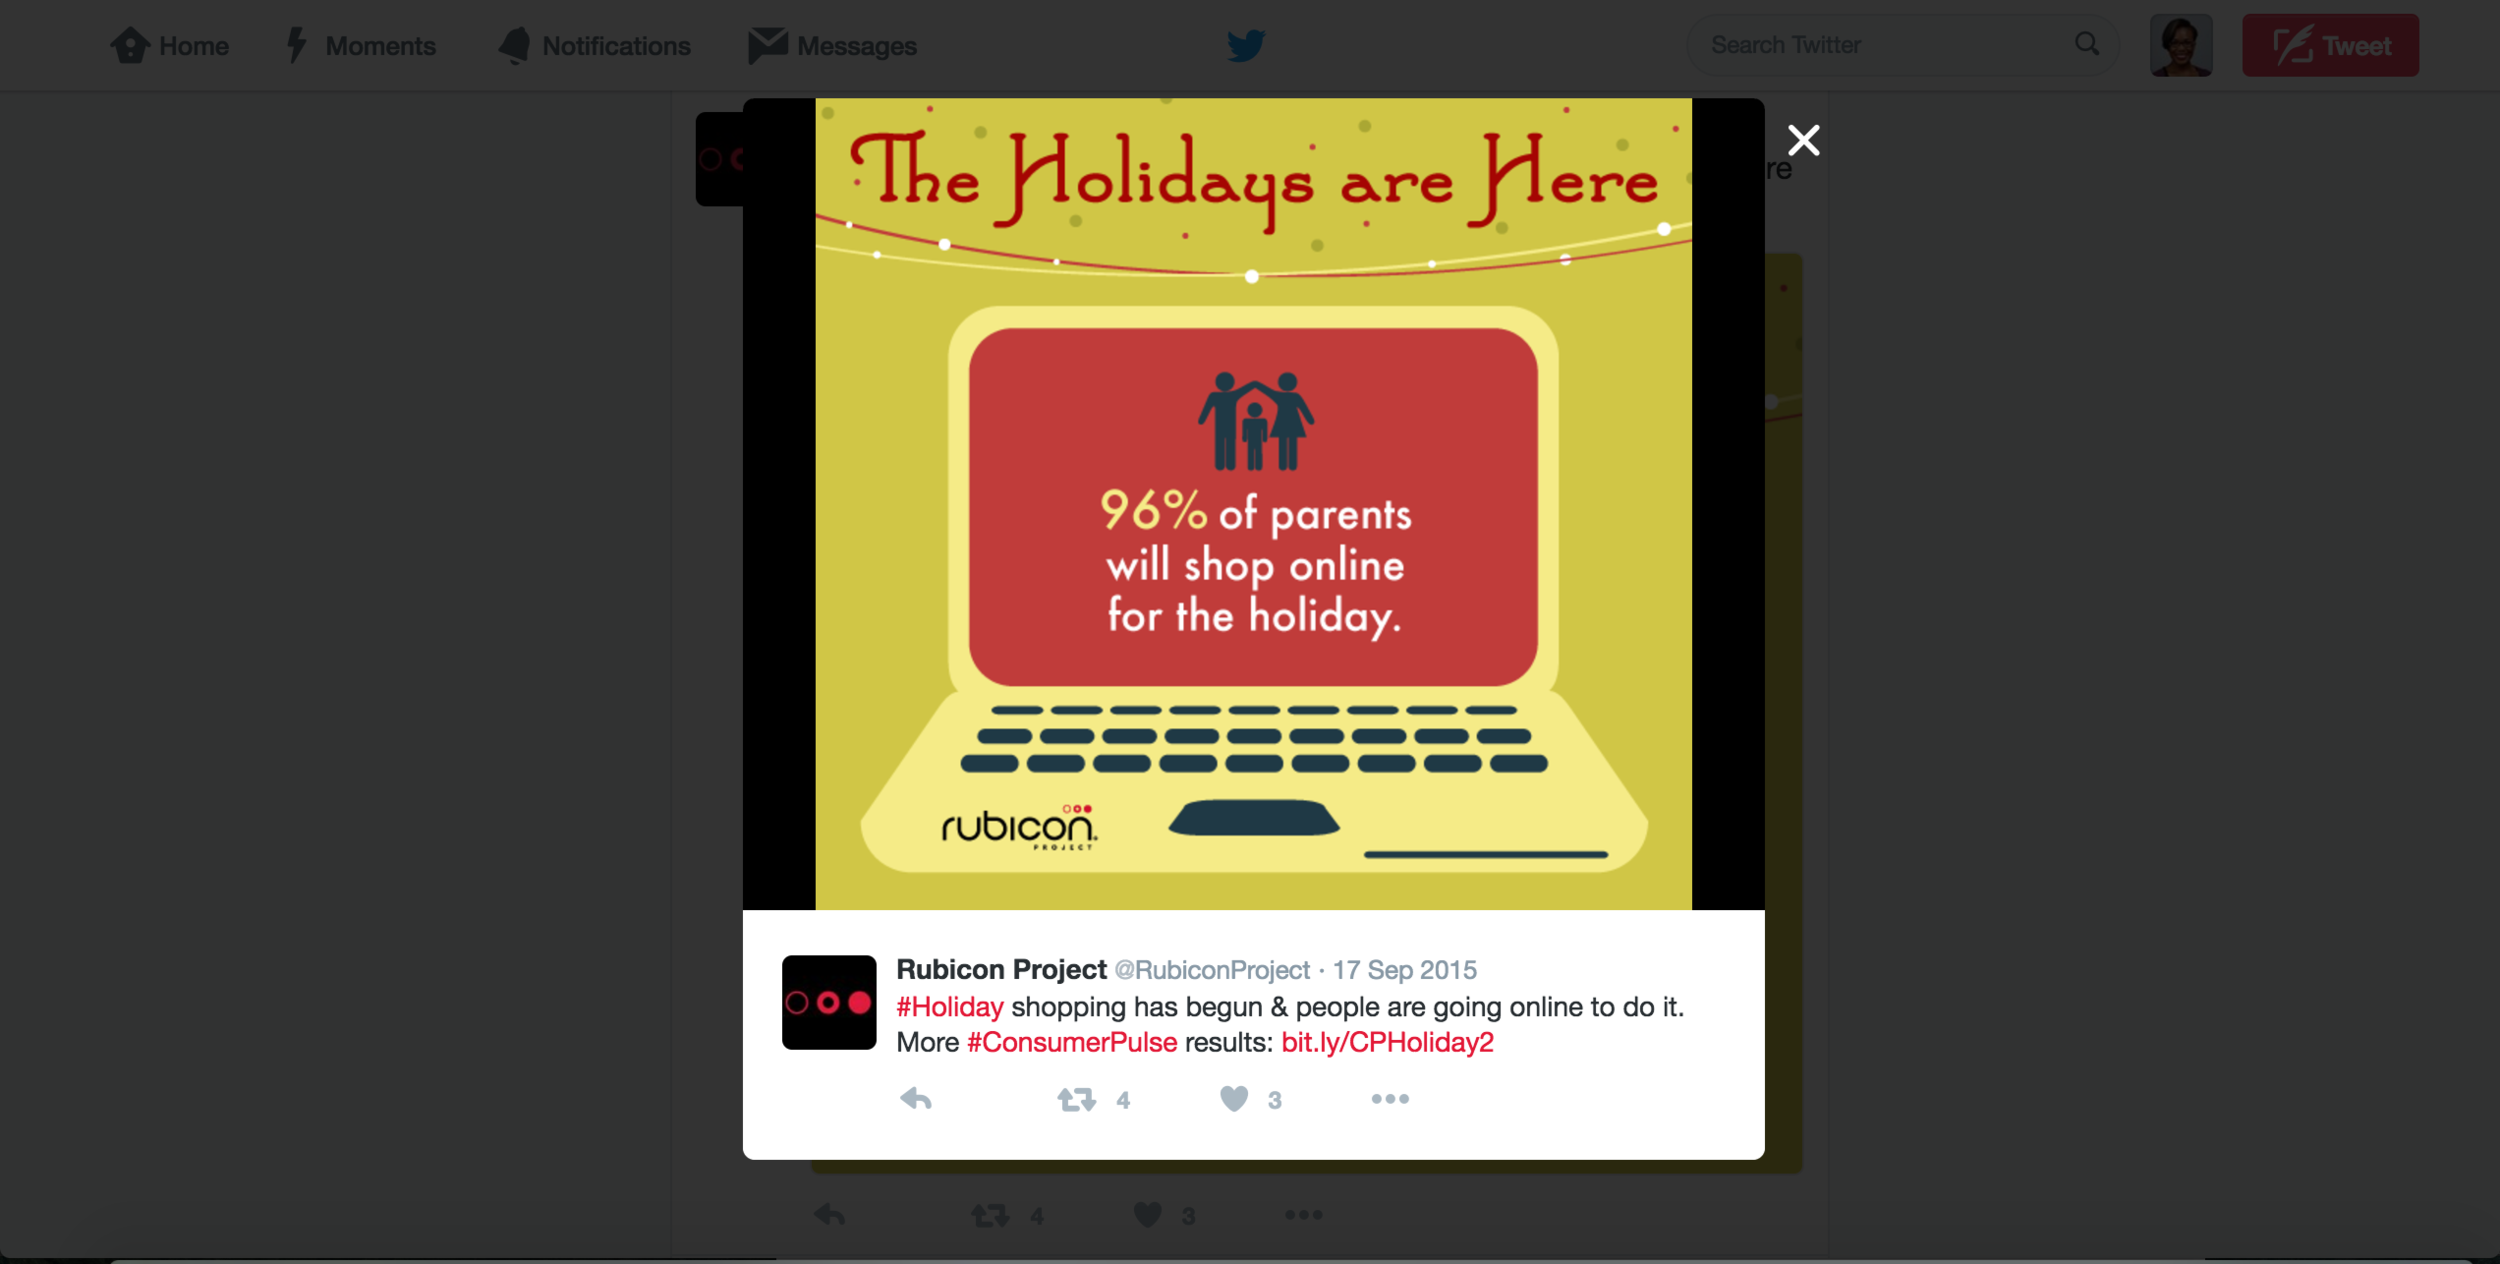
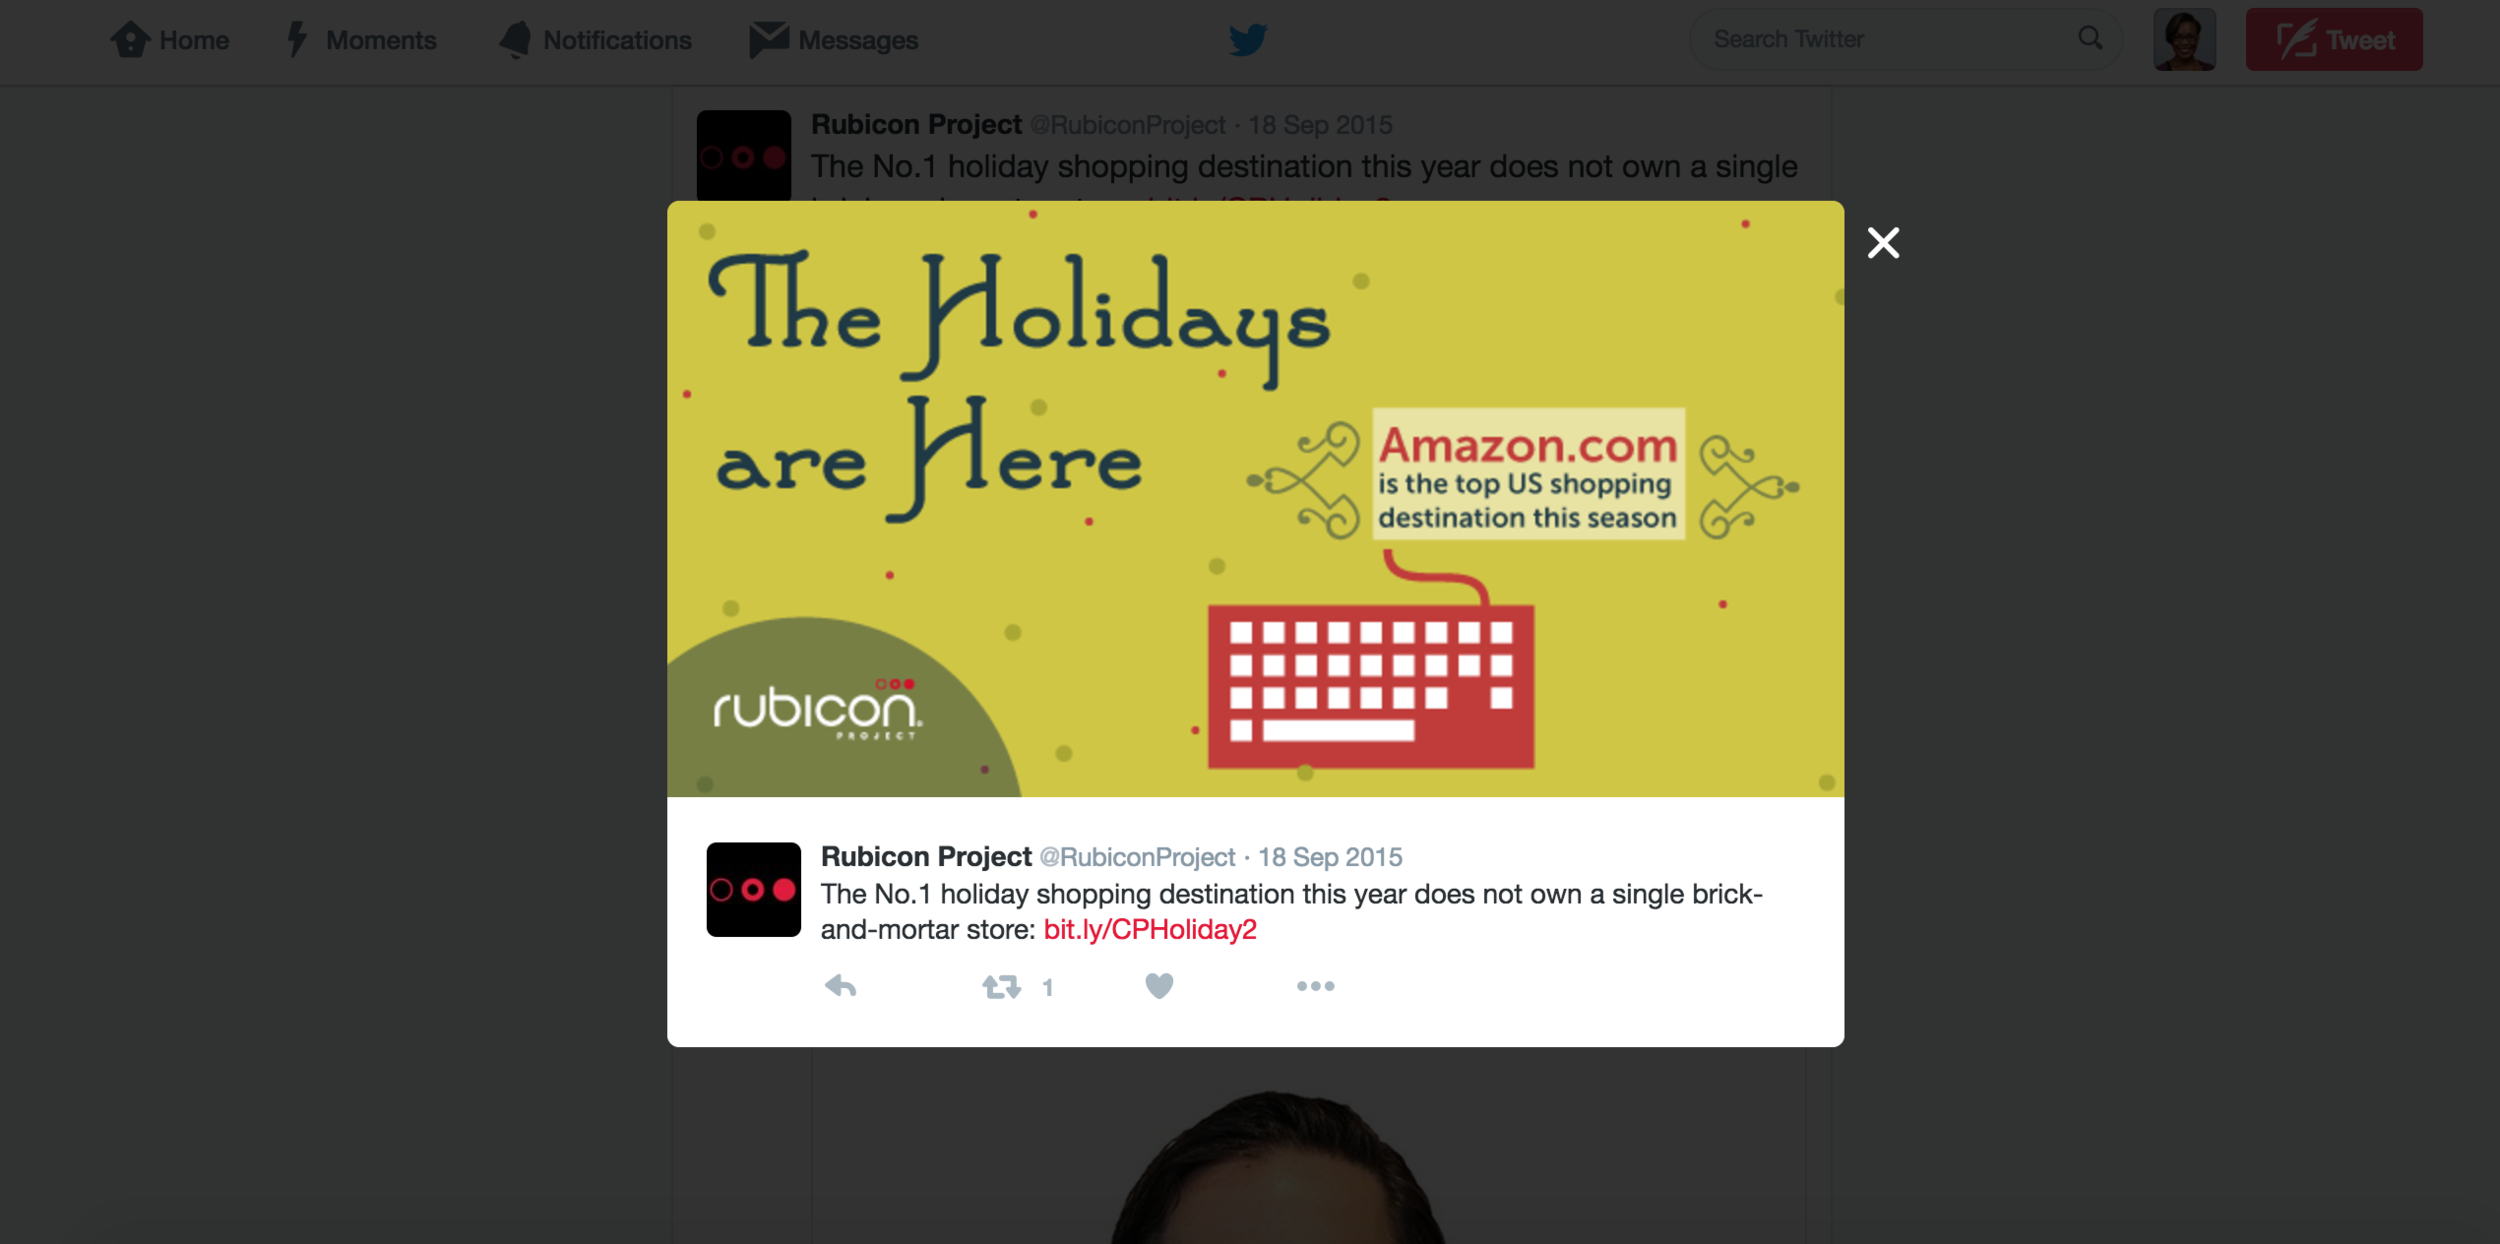
CONSUMER PULSE: CHRISTMAS 2015
This infographic highlights key findings and insights around consumer spending habits for the holiday shopping season in 2015. The final deliverables included social media graphics and digital assets for blog posts, PowerPoints and emails.

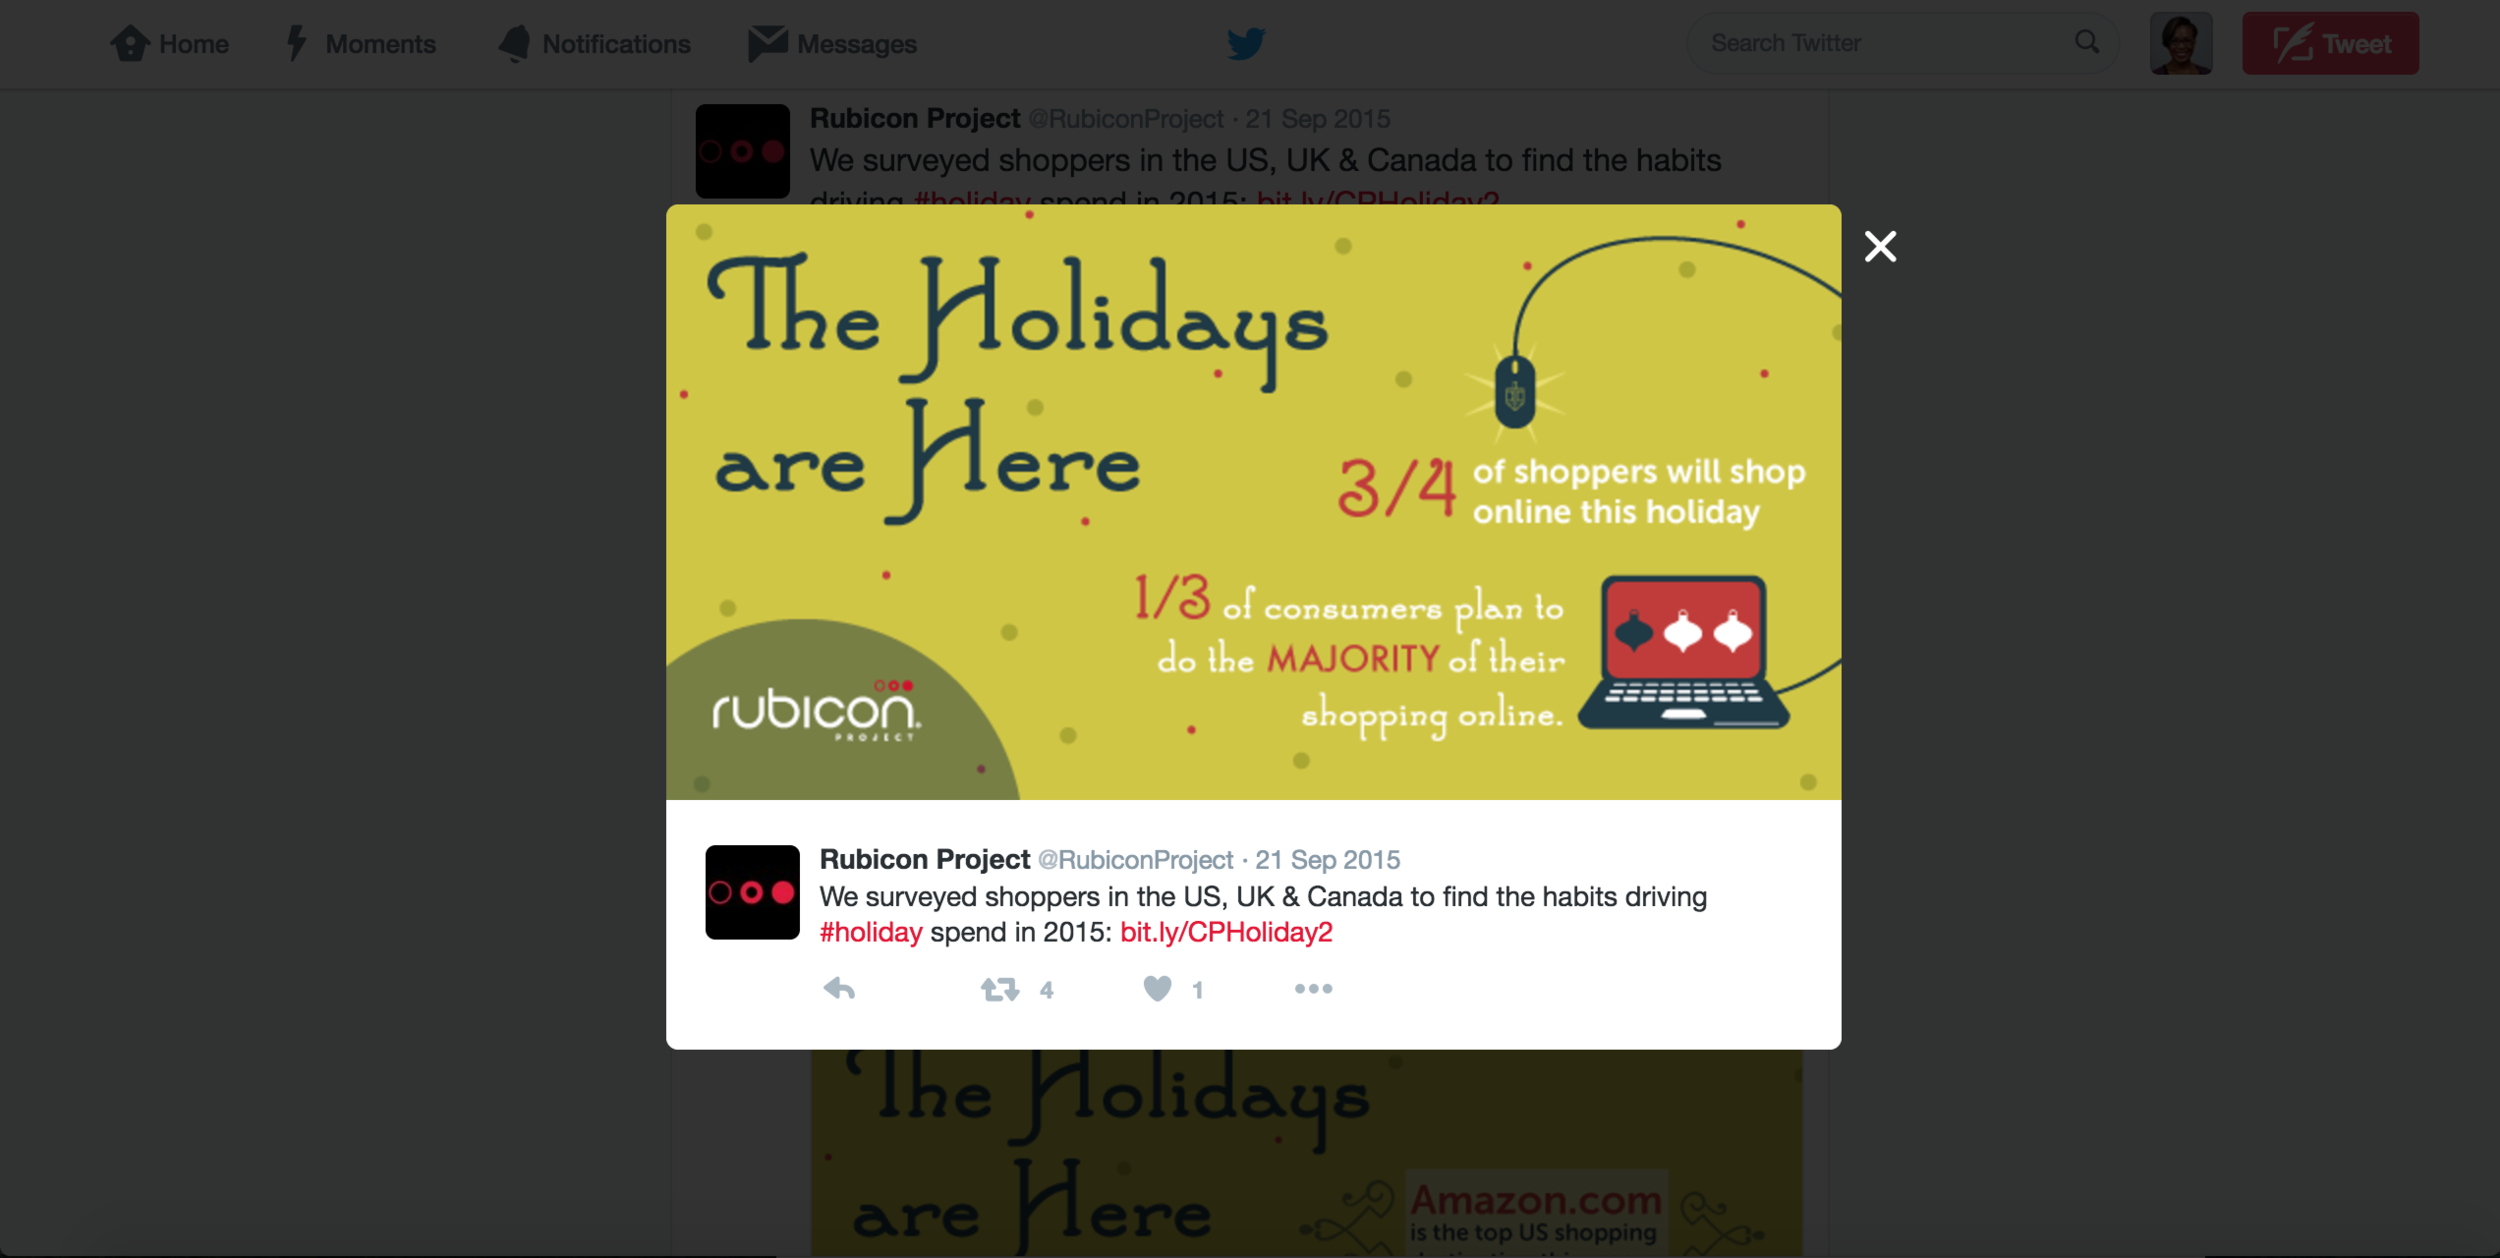
CONSUMER PULSE: CHRISTMAS 2015
This infographic highlights consumer shopping behavior in the weeks leading up to Valentine’s Day and how advertisers are courting them in real time. The final deliverables included social media graphics and digital assets for blog posts, PowerPoints and emails.

